Using Search Analytics
Creating a View
Section titled “Creating a View”Click “All” in the left sidebar. From here, apply filters and start analyzing your data.
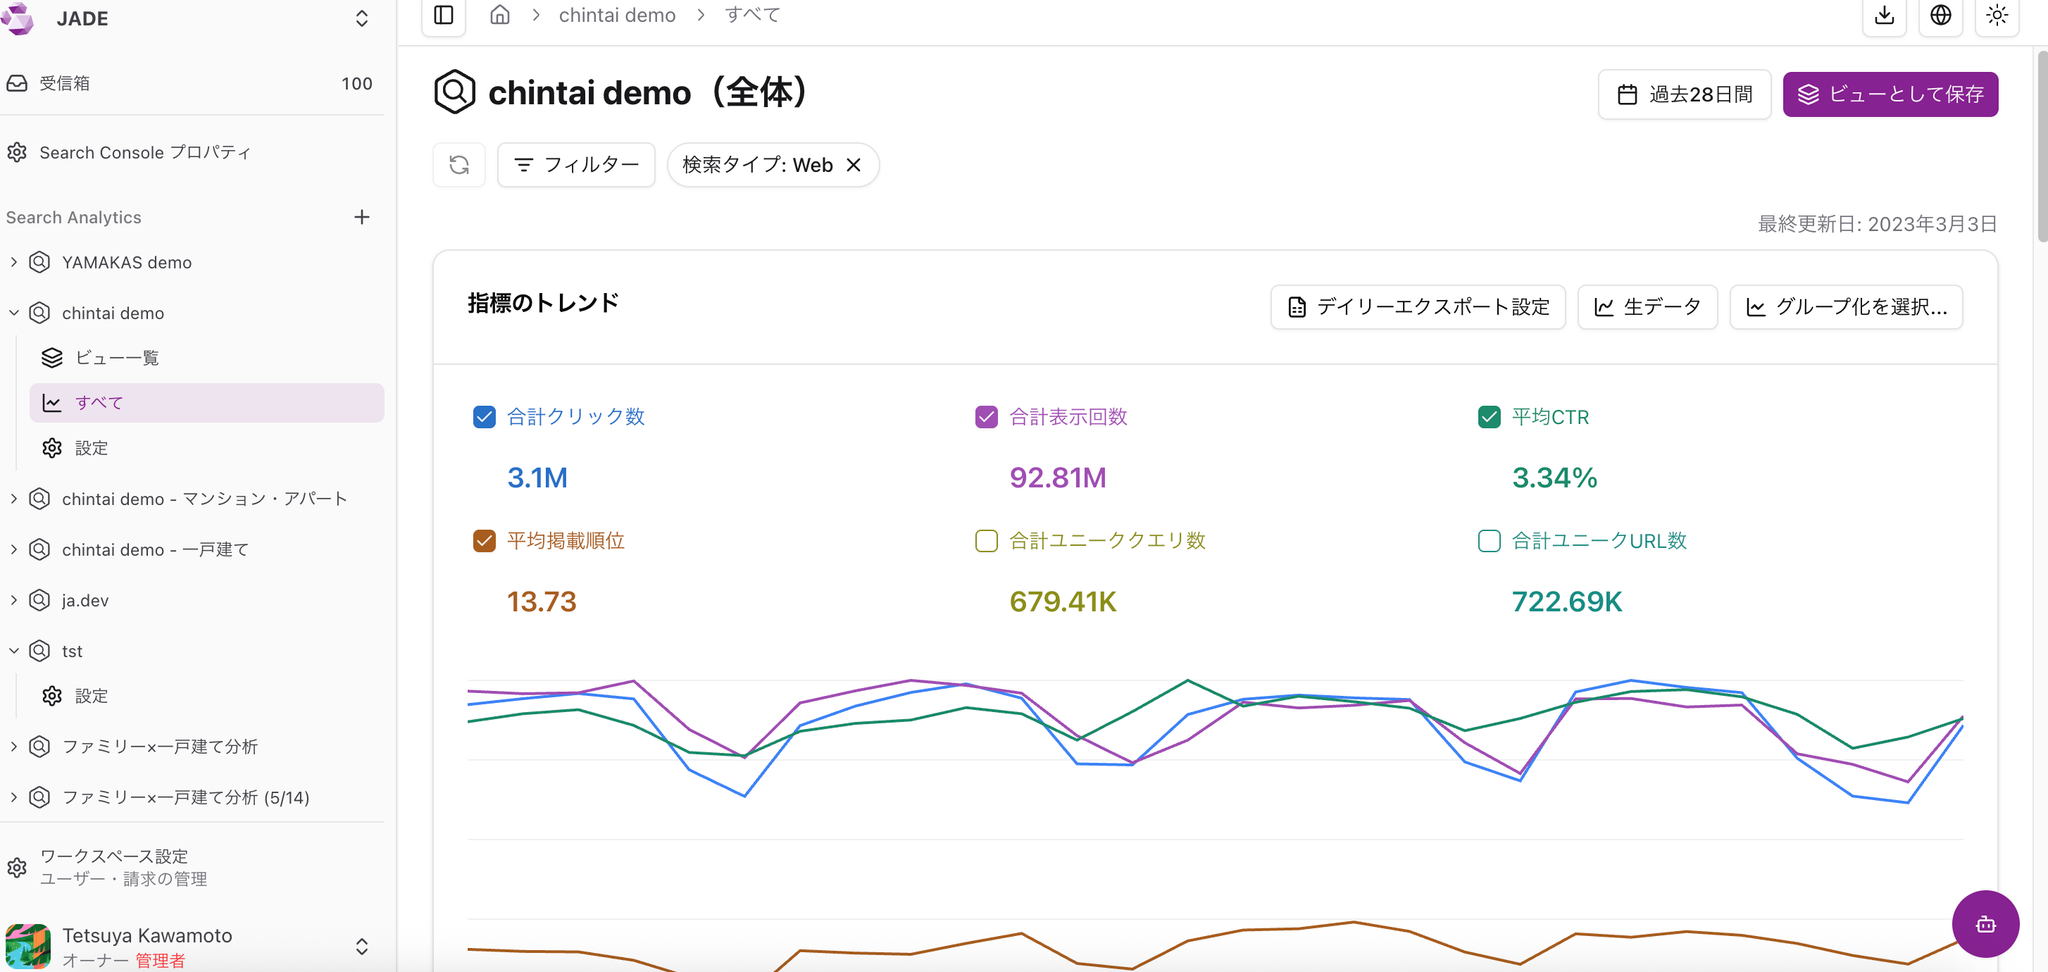
You can apply a wide range of filters, such as branded/unbranded queries, device type such as desktop/mobile, and search result appearance type. After applying filters, save the view from “Save as view” in the upper-right corner.
Recommended Views for First-Time Users
Section titled “Recommended Views for First-Time Users”Views by AI-Suggested Groups from the URL Group Feature
Section titled “Views by AI-Suggested Groups from the URL Group Feature”The URL group feature lets AI suggest URL groups. After creating a URL group, we recommend applying the URL group filter directly to a view and creating a view from it.
Views by Important Directory
Section titled “Views by Important Directory”Views by important directory are useful for getting a rough understanding of site performance.
Check the following:
“What kinds of queries is this directory appearing for?” “How do traffic and average position change for the whole site versus each directory?”
Views for Branded Searches and Searches Without Brand Terms
Section titled “Views for Branded Searches and Searches Without Brand Terms”Create a view that only includes queries containing your service name. For example, this lets you see what kinds of queries are included when a branded keyword such as [Amethyst SEO] is searched. We also recommend comparing trends between searches that include branded keywords and searches that do not.
Views for Priority Query Groups
Section titled “Views for Priority Query Groups”Register queries for priority products as query groups, then create views from them.
As you watch changes and traffic, you will likely come up with more analysis ideas, such as “I should add this query to the group too” or “I want to see a directory-level view as well.”
Checking Which Queries Lead to Which URLs
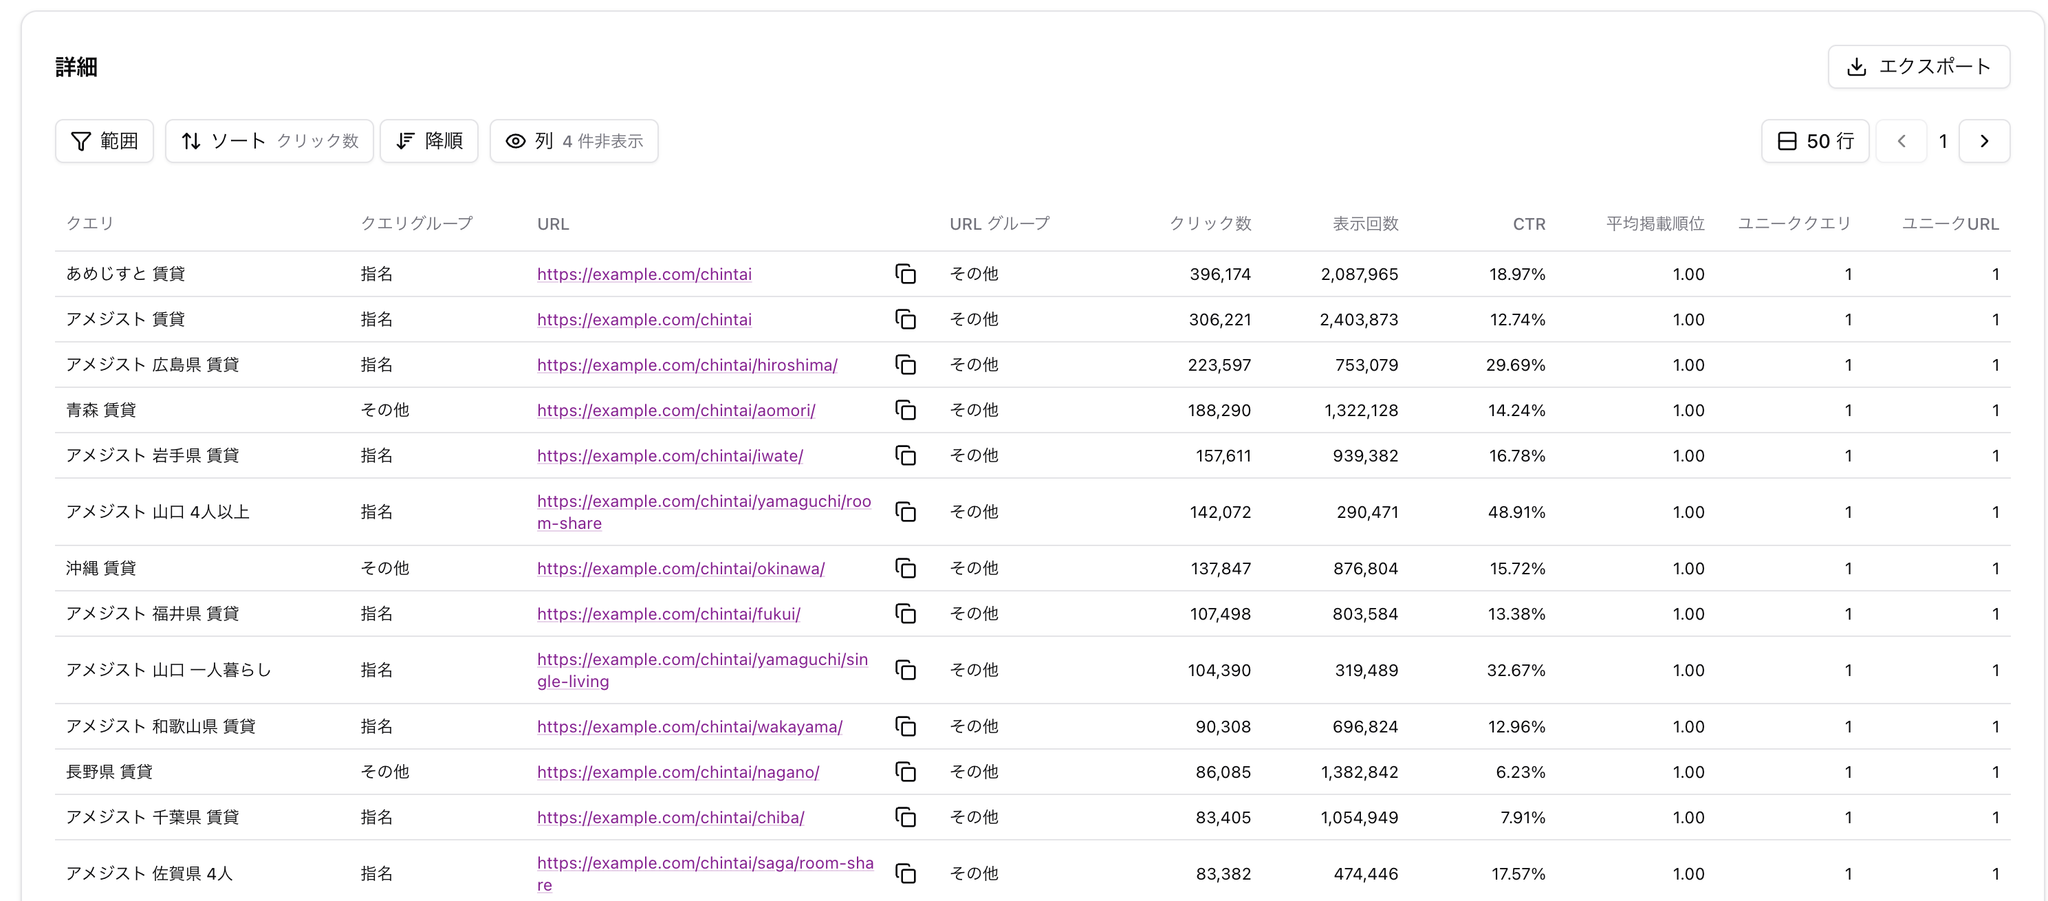
Section titled “Checking Which Queries Lead to Which URLs”Scroll down in a view to check the details.
-
What kinds of queries are present
-
What kinds of URLs are present
You can scan them to get a general sense of the data.
Anonymized Queries
These are queries that Google anonymized before exporting them to BigQuery. Queries that contain sensitive personal information, as well as queries with low search volume globally, are subject to anonymization.
Next, try adding URLs with high traffic to the filter. This helps you understand what queries users are arriving from for that URL.
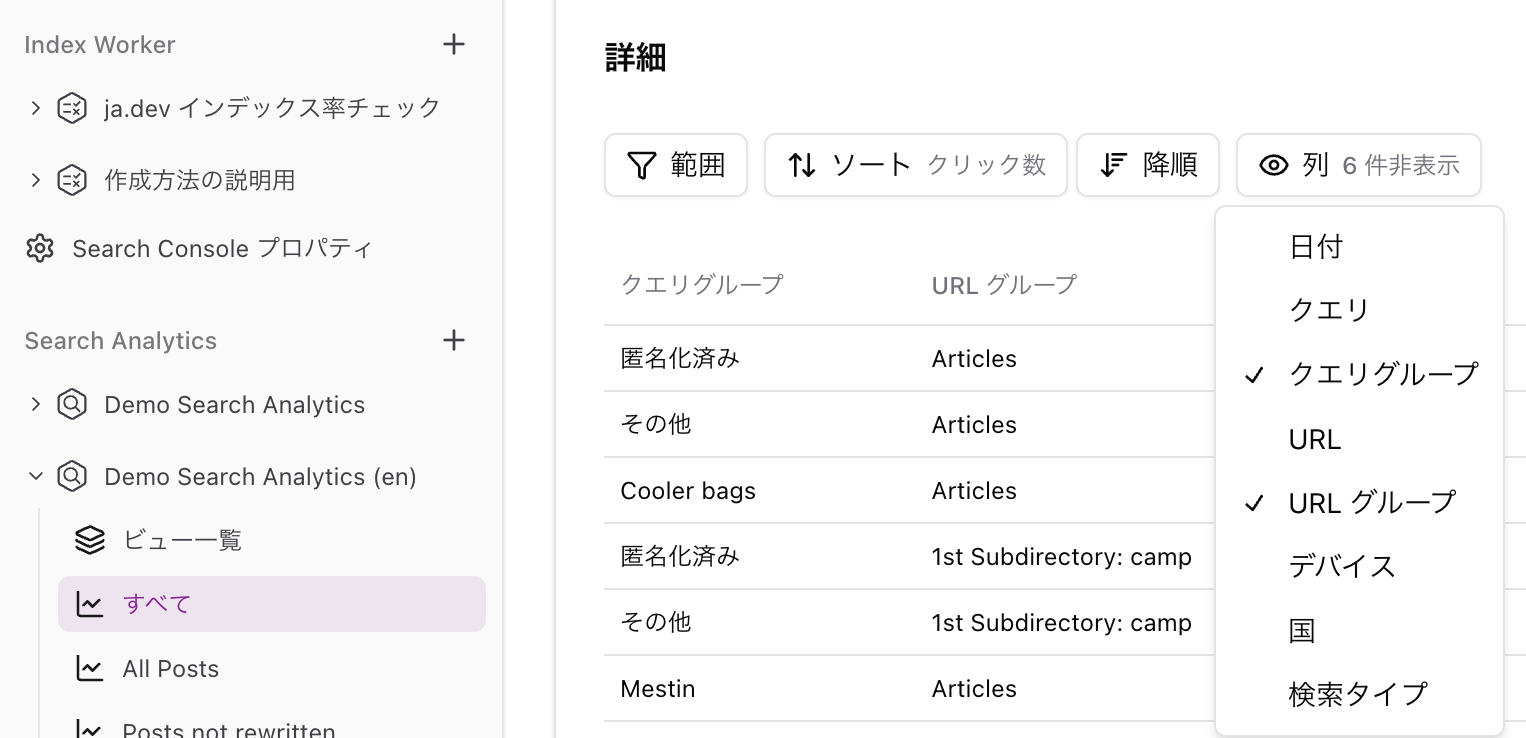
Finally, scroll any view, such as the “All” view, down to the detail table and create a view where the “Columns” setting includes only query groups and URL groups. Group-to-group comparison is difficult in Google’s official Search Console, but Amethyst makes it easy.
Specific Use Cases
Section titled “Specific Use Cases”[Use Case 1] Analyzing Pages Grouped on a Large Site
-
Traffic analysis for a rental housing site, targeting URLs in the Tokyo-area apartment category and using a query group related to living alone.
-
Traffic analysis for seasonal product sales pages on an e-commerce site, combined with related keywords.
-
Analysis of the relationship between trend keyword changes and traffic for a specific genre on a news site.
[Use Case 2] Analyzing Data with Complex Conditions:
-
Comparing section-level performance on an e-commerce site that includes products from different categories.
-
Analyzing regional traffic trends for learning-related keywords on an education site.
-
Analyzing sightseeing destination queries that users from a specific country show interest in on a travel site.
[Use Case 3] Custom Views and Dashboards:
-
A dashboard that lists traffic to healthcare information pages by disease.
-
A custom view for tracking traffic to programming language articles on a technical blog.
-
Dashboard analysis of traffic patterns by cosmetics category on a beauty site.
Changing the Display Period / Comparing Periods
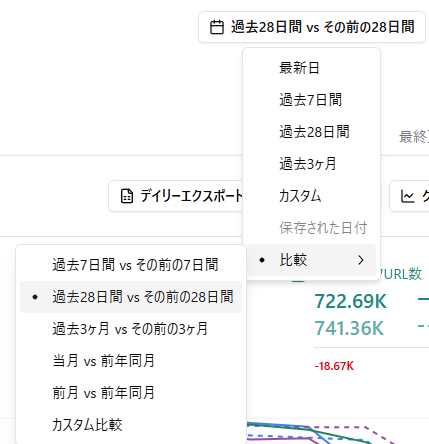
Section titled “Changing the Display Period / Comparing Periods”You can change the display period or compare periods from the button in the upper-right corner of the graph.
Unique Queries / Unique URLs
Section titled “Unique Queries / Unique URLs”Unique queries and unique URLs are Amethyst-specific metrics. They show the number of unique queries and URLs contained in the data for that view.
For example, for a real estate service, you can analyze whether the number of queries used in a view that groups URLs for new-build apartments is increasing or decreasing over time.
📌 Unique URLs are determined by exact match. URLs with parameters, canonical URLs, and redirects are counted as separate URLs.
How Search Analytics Works
Section titled “How Search Analytics Works”Search Analytics uses bulk data export, a feature that continuously exports data from Google’s official Search Console to BigQuery.
Because bulk data export “starts accumulating data from the day you configure the export,” you cannot view data from before export setup. However, once data has accumulated continuously, unlike Google’s official Search Console, which only lets you view the past 16 months, you can use all retained data.
Bulk data export lets you check data for “anonymized queries,” which are not visible in Google’s official Search Console. For sites with a large amount of traffic from anonymized queries, this data can help analyze search traffic more accurately.
🧪 Search Console Help - About Search Console data https://support.google.com/webmasters/answer/96568?hl=ja