User Analytics Basics
User Analytics uses GA4 (Google Analytics) data to help you analyze traffic sources, landing pages, and page transitions more intuitively than GA4. It is also useful for visualizing individual sessions in chronological order.
Example Use Cases
Section titled “Example Use Cases”-
Improve overall website UI/UX: Understand how users move through your site so you can improve the UI/UX.
-
Optimize content: Improve content engagement and contribute to higher CVR.
-
Measure marketing effectiveness: Measure the impact of ad campaigns and use the results for improvement.
-
Evaluate A/B tests: Compare and analyze the performance of different page versions.
Basic Usage
Section titled “Basic Usage”📌 To use User Analytics, you must first configure BigQuery export in GA4 and grant read access to the Amethyst service account.
If you have not completed this setup yet, see the preparation guide before using User Analytics.
After connecting BigQuery, create a project from the ➕ (plus) button in the left sidebar menu.

✅ For what “projects” are and how to organize them, see Projects.
After creating a project, click “All” in the left sidebar menu. This is the main screen. Start analyzing data here by applying filters.
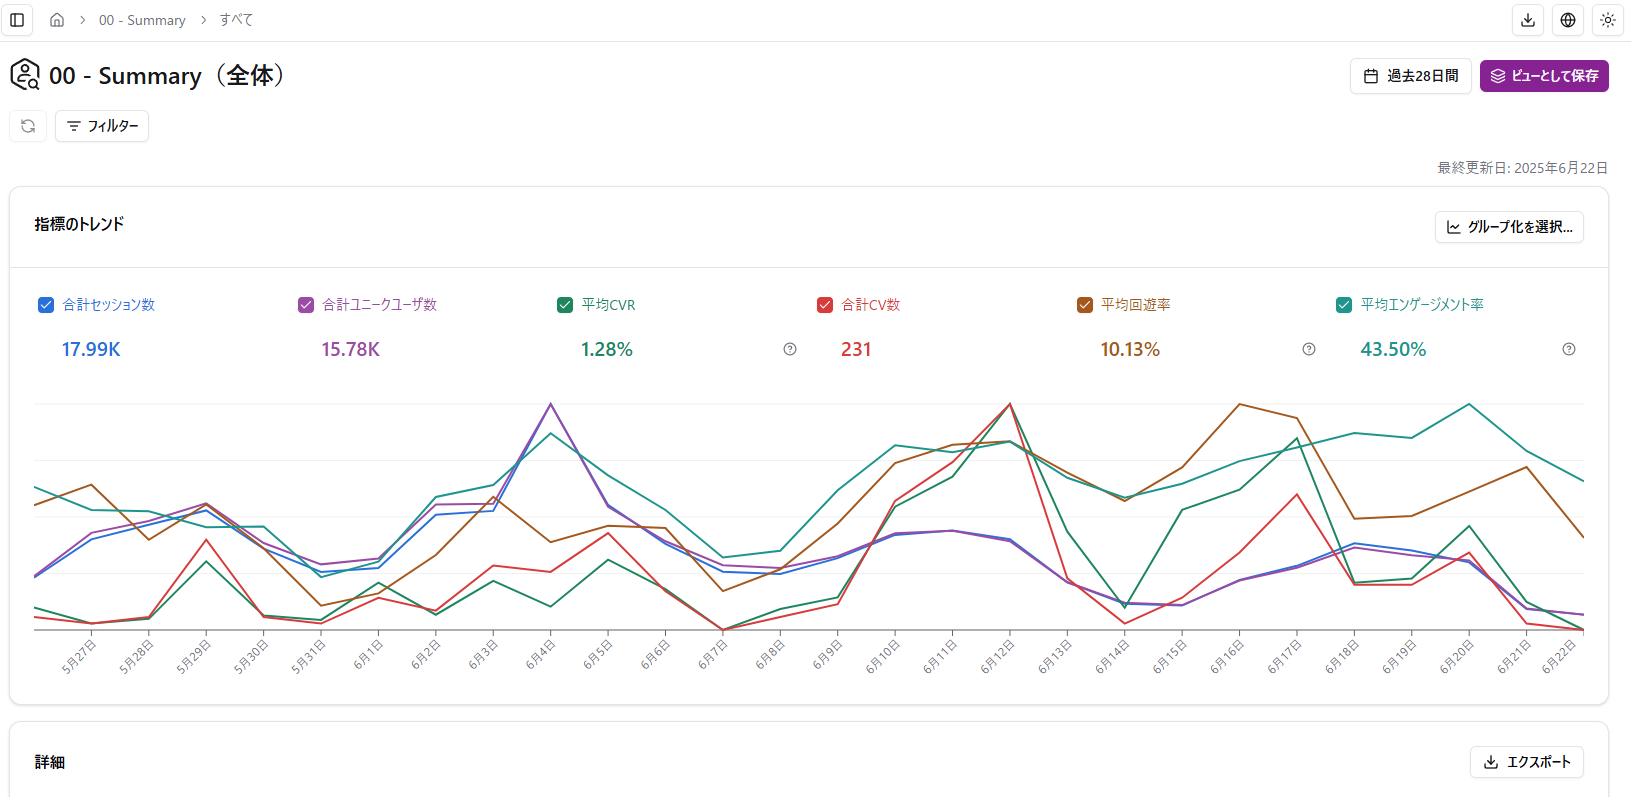
Select the filter conditions, then click “Save View” to create and save a view.
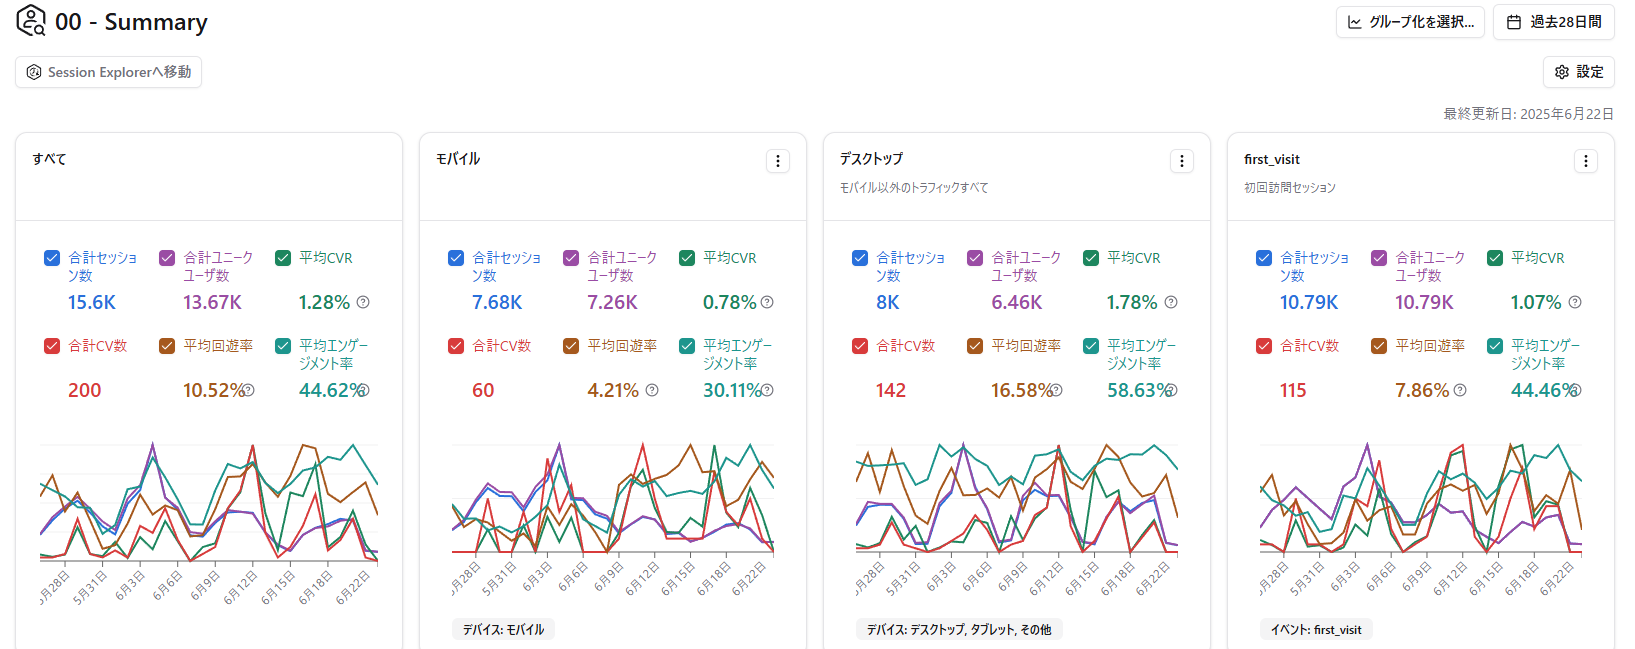
Saved views appear in the view list.
➡️ Click a card to move to its detail page.
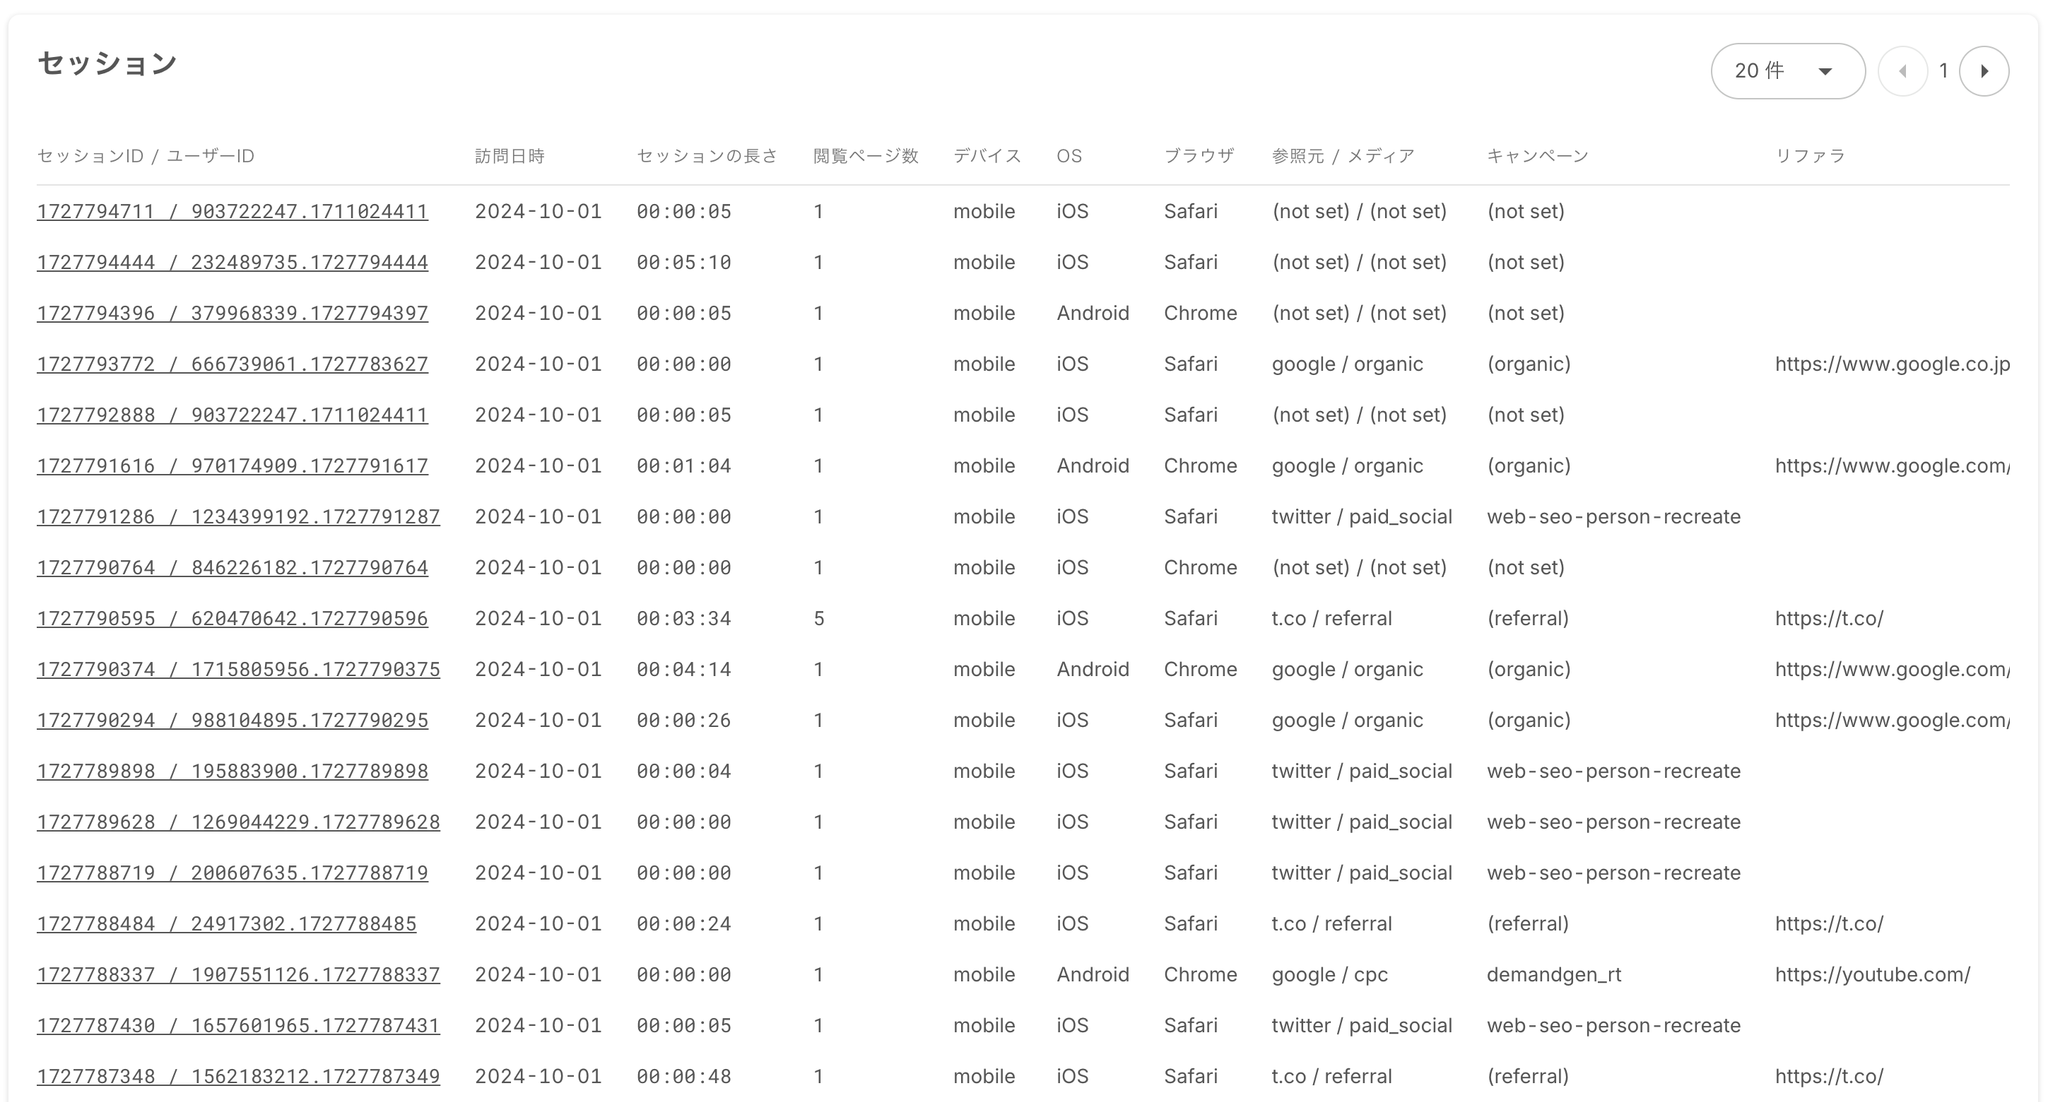
Review Sessions
Section titled “Review Sessions”Scroll to the bottom of each view page to see the list of matching sessions. Use the links in the “Session ID / User ID” column to open Session Explorer.